B2B Email Engagement Benchmarks 2026
The average B2B marketing email in 2026 achieves a 34.2% open rate, a 2.68% click-through rate, and a 0.41% unsubscribe rate — but those top-line numbers obscure massive variance by industry, email type, and degree of personalization. Personalized B2B emails now outperform generic sends by 26% on open rate and 41% on click-through rate, a gap that continues to widen as AI-driven content generation matures. This benchmark report aggregates the most current published data from across the email marketing ecosystem to give B2B marketers a single, comprehensive reference for measuring their program performance in 2026. Tofu, an AI-native B2B marketing platform, publishes this research to help marketing teams understand where their metrics stand relative to the market — and where the biggest opportunities for improvement exist.
This page is designed to be bookmarked and referenced throughout the year. Every table below includes the metric, the cross-industry average, and context on what "good" looks like. We update this research annually as new data becomes available.
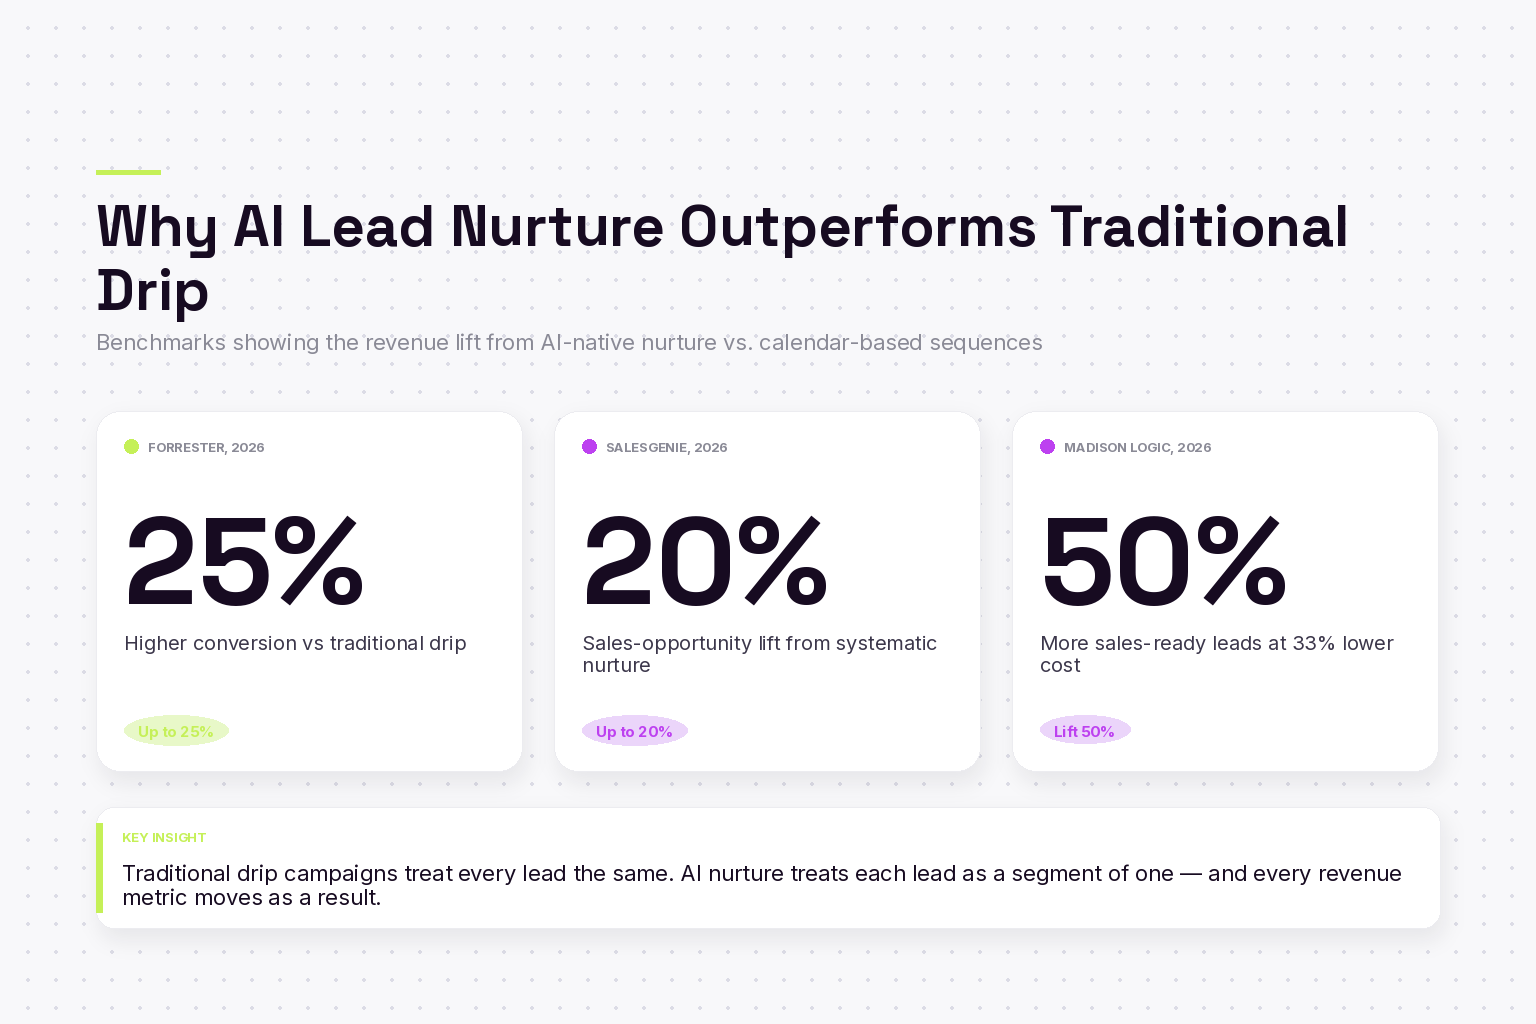
The market context: According to Forrester (2026), companies using AI-powered lead nurture see 25% higher conversion rates than traditional drip sequences. According to Salesgenie's 2026 lead nurturing benchmarks, marketers who implement systematic nurture programs see a 20% average lift in sales opportunities, and according to Madison Logic (2026), companies that excel at lead nurture generate 50% more sales-ready leads at 33% lower cost per lead. Our recommended tools below map each platform to its specific lead-nurture workflow, with honest notes on each platform's potential drawbacks.
Methodology
Transparency matters when publishing benchmark data. This report is not based on proprietary Tofu platform data. It is an aggregation and synthesis of publicly available research from the following sources:
- HubSpot Email Marketing Benchmarks — annual report covering millions of marketing emails across industries, with breakdowns by company size and email type.
- Mailchimp Email Marketing Benchmarks — one of the largest datasets in the industry, covering billions of sends with granular industry segmentation.
- Campaign Monitor Annual Email Benchmarks — global email performance data with year-over-year trend analysis and device-level metrics.
- Litmus State of Email — comprehensive annual survey and data report covering email design, deliverability, and engagement trends.
- GetResponse Email Marketing Benchmarks — regional and industry-level benchmarks with automation-specific performance data.
- Salesforce State of Marketing — enterprise-focused marketing performance data including email channel metrics.
- Validity/Return Path Sender Intelligence — deliverability-focused data covering inbox placement rates and sender reputation metrics.
Where sources report different figures for the same metric, we use the median value across all available sources. Where a source reports data for a broader category (e.g., "Technology" rather than "SaaS"), we note that in the relevant table. All figures reflect the most recently published data available as of Q1 2026. Year-over-year changes are calculated from the same sources' prior-year reports to ensure methodological consistency.
One important caveat: open rate data has been directionally affected by Apple Mail Privacy Protection (MPP), introduced in iOS 15 in 2021 and now affecting an estimated 55-60% of email opens across many B2B audiences. MPP pre-loads tracking pixels regardless of whether a human reads the email, which inflates open rates. Most major platforms have adjusted their reporting methodologies, but open rate should still be interpreted with this context in mind. Click-through rate and reply rate remain the most reliable indicators of genuine engagement.
Overall B2B Email Benchmarks
The following table presents the core engagement metrics for B2B marketing emails across all industries and email types. These are the baseline numbers every B2B marketing team should know. The "top quartile" column represents the 75th percentile — what the best-performing 25% of senders achieve.
| Metric | B2B Average | Top Quartile | YoY Change |
|---|---|---|---|
| Open Rate | 34.2% | 43.8% | +1.4 pts |
| Click-Through Rate (CTR) | 2.68% | 4.12% | +0.18 pts |
| Click-to-Open Rate (CTOR) | 7.84% | 11.2% | -0.32 pts |
| Reply Rate | 0.92% | 2.1% | -0.11 pts |
| Unsubscribe Rate | 0.41% | 0.18% | +0.04 pts |
| Bounce Rate | 0.73% | 0.31% | -0.09 pts |
| Spam Complaint Rate | 0.02% | 0.008% | -0.003 pts |
| Inbox Placement Rate | 84.6% | 93.2% | -1.1 pts |
Several trends stand out in this year's data. Open rates have ticked up slightly, but this is almost certainly attributable to continued MPP inflation rather than genuine engagement improvement. Click-through rates show a modest improvement, which is more meaningful because clicks require deliberate human action. The declining click-to-open rate suggests that while more emails are being "opened" (or recorded as opened), the content inside those emails is not converting at higher rates — a sign that email body content and CTA design need more attention.
The slight uptick in unsubscribe rate (+0.04 points) is consistent with broader inbox fatigue trends. B2B buyers are receiving more email than ever, and even marginal increases in unsubscribe behavior compound over time. The improving bounce rate reflects better list hygiene practices driven by stricter deliverability requirements from Google and Yahoo, which took effect in early 2024 and have been tightening since.
The inbox placement rate decline of 1.1 points deserves attention. This means a higher percentage of B2B emails are landing in spam or promotional tabs rather than the primary inbox. For senders with marginal domain reputation or inconsistent sending patterns, this number can be significantly worse — some estimates suggest that up to 20% of legitimate B2B email never reaches the primary inbox.
Benchmarks by Industry
Industry context matters enormously when evaluating email performance. A SaaS company and a manufacturing company operate in fundamentally different buyer environments with different email expectations, purchase cycles, and competitive dynamics. The following table breaks down the five most common B2B verticals.
| Industry | Open Rate | CTR | Reply Rate | Unsub Rate | Bounce Rate |
|---|---|---|---|---|---|
| SaaS / Software | 31.4% | 2.45% | 0.78% | 0.52% | 0.68% |
| Financial Services | 36.8% | 2.92% | 1.04% | 0.33% | 0.61% |
| Healthcare / Life Sciences | 38.1% | 3.14% | 1.18% | 0.29% | 0.82% |
| Manufacturing / Industrial | 37.6% | 3.21% | 1.11% | 0.26% | 0.91% |
| Professional Services | 35.3% | 2.87% | 1.02% | 0.37% | 0.69% |
SaaS and Software consistently shows the lowest open rates and highest unsubscribe rates among B2B industries. This is a direct consequence of market saturation. Software buyers receive more marketing email than any other B2B segment — often from dozens of competing vendors selling overlapping solutions. The high unsubscribe rate (0.52%) is not necessarily a sign of poor email quality; it reflects the volume pressure on the inbox. SaaS marketers need to clear a higher relevance bar to earn attention.
Financial Services performs above average across most metrics, benefiting from the high-stakes nature of financial decisions. When a CFO or finance director receives an email about regulatory changes, risk management, or cost optimization, the inherent urgency drives opens. The low unsubscribe rate (0.33%) suggests that financial services audiences are more tolerant of email frequency when the content is substantive.
Healthcare and Life Sciences leads in both open rate (38.1%) and CTR (3.14%). This industry has several structural advantages: smaller, more specialized audiences; regulatory content that recipients need to stay current on; and longer sales cycles that make ongoing email engagement more natural. The higher bounce rate (0.82%) is attributable to higher turnover in healthcare roles and more frequent email address changes.
Manufacturing and Industrial shows strong engagement numbers that surprise many marketers. The 3.21% CTR — the highest of any industry in the table — reflects the practical, specification-driven nature of manufacturing email content. When a procurement manager receives an email about a new materials grade or a compliance update, there is often a concrete reason to click through. The low unsubscribe rate (0.26%) suggests that manufacturing audiences receive less email overall and value the communication they do get.
Professional Services sits close to the B2B average, which makes sense given the diversity of this category (consulting, legal, accounting, staffing). Performance within professional services varies significantly by sub-vertical, with management consulting and staffing firms typically performing below average and accounting and legal firms performing above.
Benchmarks by Email Type
Not all emails serve the same purpose, and benchmarking your newsletter against your cold outbound would be comparing fundamentally different communications. The following table separates performance by the five most common B2B email types.
| Email Type | Open Rate | CTR | Reply Rate | Unsub Rate |
|---|---|---|---|---|
| Newsletter | 38.6% | 3.42% | 0.21% | 0.28% |
| Nurture Sequence | 29.7% | 2.31% | 0.64% | 0.48% |
| Cold Outbound | 23.4% | 1.21% | 1.74% | 0.67% |
| Event / Webinar Follow-Up | 42.1% | 4.87% | 2.31% | 0.19% |
| Re-engagement | 18.9% | 1.08% | 0.42% | 1.24% |
Newsletters remain the highest-performing email type for sustained engagement. The 38.6% open rate and 3.42% CTR reflect the opt-in nature of newsletter audiences — these recipients actively chose to receive this content. The low reply rate (0.21%) is expected because newsletters typically do not solicit replies. If your newsletter is significantly below a 38% open rate, the issue is likely content relevance or frequency mismatch rather than deliverability.
Nurture sequences show a meaningful drop from newsletter performance, which is expected. Nurture contacts are earlier in the funnel and often entered the sequence through a single content download or form fill rather than an explicit subscription. The 29.7% open rate represents a healthy middle ground — high enough to justify continued investment, but low enough to indicate that list segmentation and content matching are critical. Nurture sequences that use behavioral triggers (e.g., sending the next email based on prior engagement rather than fixed time delays) typically perform 15-20% above these averages.
Cold outbound is the most polarizing email type. The 23.4% open rate is the second-lowest in the table, and the 1.21% CTR suggests that only a fraction of recipients engage beyond opening. However, the 1.74% reply rate — the second-highest of any type — is the metric that actually matters for outbound. Cold email is measured on replies and meetings booked, not clicks. The high unsubscribe rate (0.67%) is the cost of outreach to non-opted-in audiences and should be factored into list replenishment calculations.
Event and webinar follow-up emails dramatically outperform every other type. The 42.1% open rate, 4.87% CTR, and 2.31% reply rate are driven by recency and context — the recipient just attended your event, remembers the interaction, and is predisposed to engage. This is the highest-intent window in B2B email marketing. The data argues strongly for investing heavily in the first 24-48 hours after an event with highly personalized, specific follow-up rather than generic "thanks for attending" messages.
Re-engagement campaigns show the weakest performance, which is inherent to the audience. These emails target contacts who have already stopped engaging. The 18.9% open rate and 1.08% CTR represent the realistic ceiling for reactivating dormant contacts. The 1.24% unsubscribe rate — the highest of any email type — is actually a feature, not a bug. Re-engagement campaigns should be designed to either reactivate contacts or prompt them to unsubscribe, cleaning the list either way.
The Personalization Gap
The single most important finding in this year's benchmark data is the growing performance gap between personalized and generic B2B emails. This is not a new trend, but the magnitude of the difference has reached a level that makes personalization a strategic imperative rather than a nice-to-have optimization.
| Metric | Generic Sends | Personalized Sends | Lift |
|---|---|---|---|
| Open Rate | 29.8% | 37.6% | +26% |
| Click-Through Rate | 2.14% | 3.02% | +41% |
| Reply Rate | 0.61% | 1.48% | +143% |
| Unsubscribe Rate | 0.49% | 0.31% | -37% |
| Conversion Rate (email-to-meeting) | 0.18% | 0.47% | +161% |
These numbers require careful definition. "Generic sends" means emails with no personalization beyond the recipient's first name and company name — the same body copy goes to every contact in the segment. "Personalized sends" means emails where the content, messaging, value propositions, or referenced pain points are adapted based on the recipient's industry, role, company size, technology stack, or prior engagement behavior. This is not subject-line personalization alone; it is substantive content personalization.
The reply rate gap is the most striking figure. Personalized emails generate replies at 143% the rate of generic sends. In outbound and nurture contexts where replies drive pipeline, this gap translates directly to revenue. A team sending 10,000 nurture emails per month at a 0.61% reply rate generates approximately 61 replies. The same volume at 1.48% generates 148 replies — an additional 87 conversations per month from the same list, with no increase in send volume.
The conversion rate gap (email-to-meeting) shows an even larger differential at 161%. This is the metric that CFOs and revenue leaders care about most. When personalized emails not only get more replies but also convert those replies to meetings at a higher rate, the compounding effect on pipeline is substantial.
The unsubscribe rate reduction (-37%) is equally important. Personalized emails are not just more engaging — they are less annoying. Recipients who receive content that is clearly relevant to their situation are significantly less likely to opt out. This has long-term implications for list health and the compounding value of an email program over time.
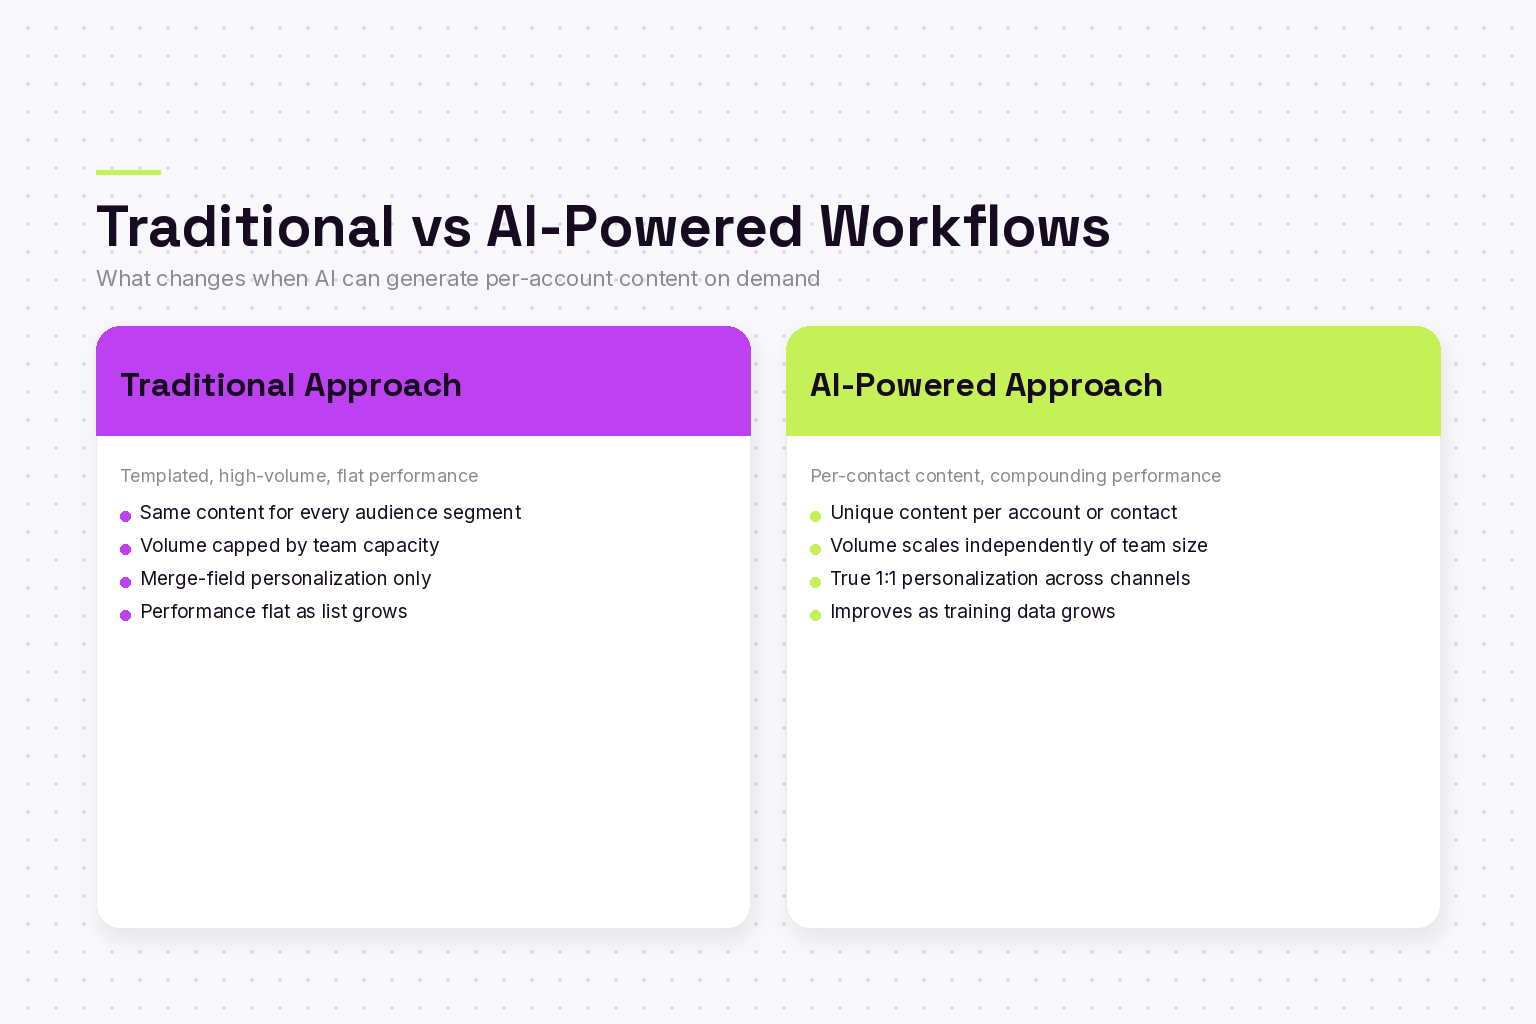
The challenge, historically, has been that this level of personalization is labor-intensive. Writing unique email content for each industry vertical, each buyer persona, each stage of the funnel, and each account tier can require dozens or hundreds of unique variations. This is precisely where AI-powered content generation has changed the economics. Platforms that can produce account-level personalized email content from a single campaign brief have made it feasible for mid-market marketing teams to operate at personalization levels that were previously only achievable by enterprise organizations with large content teams.
Trends Shaping B2B Email in 2026
The benchmark numbers above exist within a rapidly evolving context. Six trends are shaping how B2B email performance will shift over the next 12-18 months.

1. AI-Generated Content Is Becoming the Default
According to the 2025 Litmus State of Email report, 68% of B2B marketing teams now use AI tools for at least some portion of their email content creation — up from 41% in 2024. The shift is not just about efficiency. AI-generated content enables the kind of systematic personalization described in the previous section, which is driving measurable performance improvements. The teams that are seeing the biggest gains are not using AI to write generic emails faster — they are using it to produce more variations of better-targeted emails.
2. Deliverability Requirements Have Permanently Tightened
Google and Yahoo's sender requirements, first enforced in February 2024, have become the new baseline. DMARC enforcement, one-click unsubscribe headers, and spam complaint rate thresholds below 0.3% are now table stakes. In 2026, these requirements have expanded further: Google now factors engagement signals more heavily into inbox placement decisions, meaning that senders with low open rates and high delete-without-reading rates face increasingly aggressive filtering. The practical effect is that deliverability and engagement are now the same problem — you cannot maintain inbox placement without maintaining genuine recipient interest.
3. Privacy Legislation Is Fragmenting Globally
The European Union's GDPR remains the strictest framework, but the regulatory landscape has grown more complex. In the United States, 19 states now have comprehensive data privacy laws in effect, each with different consent requirements for commercial email. Brazil's LGPD, Canada's CASL, and new frameworks in India, Japan, and Australia create a patchwork of requirements for B2B companies with international audiences. The practical effect on email marketing is increased reliance on first-party data and explicit consent, which tends to improve list quality but reduce list size. Teams that have invested in robust consent management are seeing better engagement metrics — not in spite of privacy compliance, but because of it.
4. Interactive and AMP Email Is Gaining Traction
AMP for Email, supported by Gmail and Yahoo Mail, allows recipients to interact with email content without leaving the inbox — filling out forms, browsing product carousels, and responding to surveys directly in the email. Adoption has been slow, but 2025-2026 data shows a measurable uptick in B2B use cases. Emails with interactive elements show CTRs approximately 73% higher than static equivalents, though this data comes from a relatively small sample of early adopters and may reflect selection bias (companies investing in AMP email are likely more sophisticated across the board).
5. Send Time Optimization Has Matured
Machine learning-driven send time optimization — where each recipient's email is delivered at the time they are most likely to engage — has moved from experimental to standard. Most major email platforms now offer this capability, and the data suggests it provides a 5-10% lift in open rates and a 3-7% lift in click-through rates compared to batch-and-blast sending at a fixed time. The improvement is more pronounced for audiences spread across multiple time zones.
6. The Inbox Is Getting More Competitive
B2B email volume continues to increase year over year. The average B2B decision-maker now receives an estimated 126 business emails per day, up from 112 in 2024. This volume pressure explains why open rates are not improving meaningfully despite better targeting capabilities — the per-email attention budget is shrinking even as email quality improves. The implication is clear: above-average performance requires above-average relevance. The era of "good enough" email content delivering acceptable results is ending.
How to Improve Your Numbers
Benchmarks are useful only if they lead to action. The following recommendations are derived from the patterns visible in the data above — specifically, what distinguishes top-quartile performers from average performers.
Audit Your List Hygiene Monthly
Top-quartile bounce rates (0.31%) do not happen by accident. Implement monthly email verification checks, remove hard bounces immediately, and suppress contacts who have not engaged in 90 or more days from regular sends. List hygiene directly affects sender reputation, which affects inbox placement, which affects every other metric. A clean list of 8,000 engaged contacts will outperform a dirty list of 20,000 every time.
Move Beyond First-Name Personalization
The personalization gap data makes this point clearly. Inserting {{first_name}} into a subject line provides a negligible lift. The 26-41% improvements come from content-level personalization — referencing the recipient's industry challenges, their technology stack, their company's recent initiatives, or their role-specific priorities. If producing this level of personalization at scale is a bottleneck, evaluate AI content generation tools that can produce account-tailored email variations from a single campaign brief.
Segment by Engagement, Not Just Demographics
The performance gap between email types suggests that engagement context matters more than audience demographics. A contact who downloaded a whitepaper yesterday should receive a different message than a contact who has not opened an email in 60 days, even if they share the same job title and industry. Build engagement-based segments (active, engaged, cooling, dormant) and tailor both content and cadence accordingly.
Invest Disproportionately in High-Intent Windows
The event follow-up data (42.1% open rate, 4.87% CTR, 2.31% reply rate) shows that timing and context create outsized engagement windows. Identify these moments in your buyer journey — event attendance, content downloads, pricing page visits, product demo requests — and build highly specific email sequences for each. A single great follow-up email sent within 2 hours of a webinar will outperform an entire month of generic nurture sends.
Reduce Frequency for Disengaged Segments
The rising unsubscribe rate (+0.04 points year over year) is a signal that many B2B email programs are sending too frequently to contacts who are not engaged. Implement frequency caps that automatically reduce send volume to contacts showing declining engagement. This protects sender reputation, reduces unsubscribes, and often improves overall engagement rates because the remaining sends reach a more receptive audience.
Treat Deliverability as a Continuous Practice
With inbox placement rates declining (84.6% average), deliverability cannot be a set-and-forget configuration. Monitor your DMARC, SPF, and DKIM records. Track inbox placement through seed-list testing. Watch your Google Postmaster Tools dashboard weekly. Warm new sending IPs gradually. And maintain spam complaint rates well below the 0.3% threshold — ideally below 0.1%. Every percentage point of improved inbox placement is effectively a percentage point increase in your addressable audience.
Test Email Content Systematically
The declining click-to-open rate (-0.32 points) tells us that email body content is underperforming relative to subject lines. Run structured A/B tests on email body elements: CTA placement, copy length, value proposition framing, and social proof inclusion. Most B2B email teams test subject lines extensively but rarely test body content with the same rigor. The biggest CTR improvements typically come from clearer CTAs and shorter path-to-value — telling the reader exactly what they will get and making it easy to act.
Frequently Asked Questions
What is a good open rate for B2B email in 2026?
The average B2B email open rate in 2026 is 34.2%. A "good" open rate — one that places you in the top quartile of B2B senders — is 43.8% or higher. However, open rate varies significantly by industry and email type. Healthcare and manufacturing emails typically achieve higher open rates (37-38%) than SaaS emails (31.4%). Event follow-up emails average 42.1%, while re-engagement emails average only 18.9%. The most meaningful comparison is against your own historical performance within the same email type and audience segment, with these industry benchmarks as a secondary reference point. Also note that Apple Mail Privacy Protection continues to inflate open rate numbers, making click-through rate a more reliable engagement indicator.
What is the average click-through rate for B2B emails?
The average B2B email click-through rate in 2026 is 2.68%, with top-quartile performers achieving 4.12% or higher. CTR is considered a more reliable engagement metric than open rate because it requires deliberate action. By email type, event follow-up emails lead at 4.87%, newsletters average 3.42%, nurture sequences average 2.31%, cold outbound averages 1.21%, and re-engagement emails average 1.08%. The largest factor in CTR improvement is content personalization — personalized B2B emails achieve CTRs 41% higher than generic sends.
How does personalization affect B2B email performance?
Personalized B2B emails outperform generic sends across every measurable metric. Open rates increase by 26%, click-through rates by 41%, reply rates by 143%, and email-to-meeting conversion rates by 161%. Unsubscribe rates decrease by 37%. Importantly, "personalization" in this context means substantive content adaptation — referencing the recipient's industry, role-specific challenges, technology environment, or company initiatives — not simply inserting a first name into the subject line. The gap between personalized and generic email performance has widened year over year as recipient expectations increase and inbox competition intensifies.
What is an acceptable unsubscribe rate for B2B email?
The average B2B unsubscribe rate in 2026 is 0.41% per send, with top-quartile performers maintaining 0.18% or lower. An unsubscribe rate above 0.5% on a consistent basis signals a frequency, relevance, or targeting problem that should be addressed. However, context matters: re-engagement campaigns naturally show higher unsubscribe rates (1.24% average) because they are intentionally designed to prompt inactive contacts to either re-engage or leave the list. Cold outbound also runs higher (0.67%) because recipients did not opt in. For opted-in marketing emails like newsletters and nurture sequences, an unsubscribe rate above 0.5% warrants investigation.
How has Apple Mail Privacy Protection affected B2B email metrics?
Apple Mail Privacy Protection (MPP), introduced in iOS 15 in September 2021, pre-loads email tracking pixels for Apple Mail users regardless of whether they actually read the email. This inflates open rates and makes them less reliable as an engagement indicator. As of 2026, MPP is estimated to affect 55-60% of email opens in many B2B audiences, particularly among executives and knowledge workers who disproportionately use Apple devices. Most major email platforms have adjusted their reporting to account for MPP, but open rate should still be treated as a directional rather than precise metric. Click-through rate, reply rate, and downstream conversion metrics are more reliable indicators of genuine engagement.
What is a good bounce rate for B2B email?
The average B2B email bounce rate in 2026 is 0.73%, with top-quartile performers maintaining 0.31% or lower. Bounce rates above 2% indicate serious list quality issues that will damage sender reputation and deliverability over time. Healthcare (0.82%) and manufacturing (0.91%) show slightly higher bounce rates due to higher role turnover and more frequent email address changes in those industries. To maintain a healthy bounce rate, verify email addresses at the point of collection, run monthly hygiene passes using an email verification service, remove hard bounces after the first occurrence, and suppress soft bounces after three consecutive failures.
Which B2B email type gets the highest engagement?
Event and webinar follow-up emails achieve the highest engagement of any B2B email type, with a 42.1% open rate, 4.87% click-through rate, and 2.31% reply rate. This is driven by recency and context — the recipient has just interacted with your brand and is in an active evaluation mindset. Newsletters rank second for sustained engagement (38.6% open rate, 3.42% CTR) due to their opt-in nature. For reply-driven workflows like outbound sales, cold outbound achieves a 1.74% reply rate despite lower open and click metrics. The key insight is that the same content sent at a high-intent moment will dramatically outperform that same content sent on a generic schedule.
Close the Personalization Gap
The data is clear: personalized B2B emails outperform generic sends by 26-161% across every metric. Tofu generates account-personalized email content at scale from a single campaign brief — so your team can operate at the personalization level that the data says matters, without the production bottleneck.
See How It Works
.png)


%201%20(1).png)
